


VC#13 - Subscription Business KPI Benchmarks
A look at Marketing Expenses, Engagement Rates, Conversion and Retention

Hello there. I am happy to publish some benchmarks for consumer subscription businesses. This has taken me a bit of time to compile so I hope you find it useful.
1. Setup
This started as a pure hobby project and my data is not perfect by any means so please exercise your best discretion when relying on these findings.
I have been working on another post on LTV/CAC in the current environment - but that is still being baked, so to speak.
Methodology - Anonymized data from 344 subscription companies in India, SEA, Middle East and Americas. of this universe, ~85 are listed while the rest are from deals that have crossed my desk in the last 18 months.
This excludes E-commerce - that’s a whole different game altogether. So if you want to send underwear every month to people who can’t wash theirs - this is not going to be very helpful for you.
We have covered 6 broad areas here - EdTech, Fintech, Productivity, Entertainment, Gaming and Online Dating.
1 USD = INR 75.
2. Marketing Spends
Freemium models seem to be a lot more efficient than paid subscriptions in terms of driving down marketing costs and delivering better long term values.
Here is a chart on marketing spends as a % of gross profits and its distribution over the sample set.

Top quartile freemium companies are spending only ~17% of their GP on marketing as compared to ~27% for paid subscription businesses.
3. Engagement Rates
Most common metric is DAU/MAU - it’s a pretty solid proxy for how dedicated users are to your products. DAU/MAU needs to be ~50% to be in the 90th percentile or better. Anything above ~38% is in the top quartile.

Now, there is a significant issue here - which is verticals. Lumping in Tinder with Zerodha will give us absolute garbage. Here is a breakup by verticals:

I will admit here that I am not very happy about the Online dating metrics - they look inflated and my sample size here is a bit small. So take it with a pinch of salt1.
4. Conversion
Now that we have engaged the customers - time to convert them. DAU/MAU seems to be incredibly well correlated with conversion rate. it makes sense intuitively - higher engagement means more opportunity to sell. However, seeing it was a revelation even for me - with an R² of ~80%. Wow!!

Broadly, every 10% change in engagement is correlated with an ~2% change in conversion rate.
5. Retention
Finally, now that we have converted the customer - it is now time to keep them on as customers. It is not as easy and a bunch of factors start playing into this. As a parody of Hotel California went:
you can spend any amount you want, but they would surely leave...
(guitar solo follows).
___
a. Overall Stats
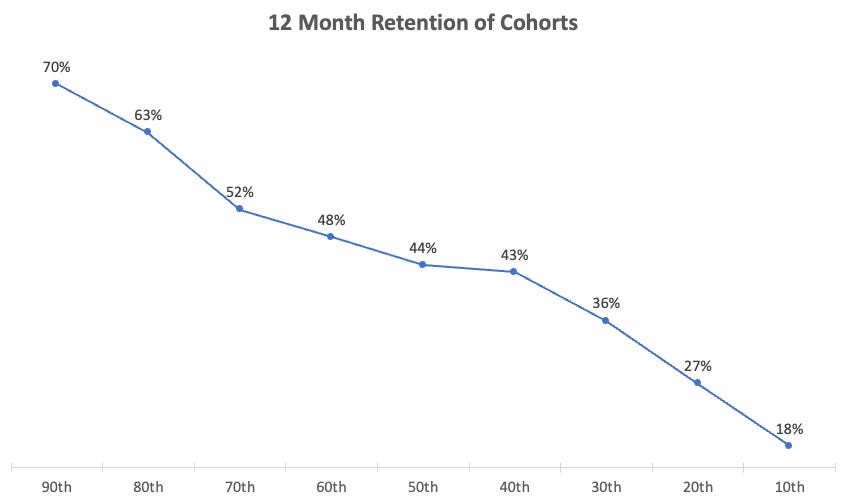
The following chart gives the distribution of blended retention rates across the sample. Given that this data is from companies who have given their data at various frequencies (monthly, quarterly, annual etc.), I have normalized this to annual to make a valid comparison.
Key Takeaways:
Median Annual retention is ~50%.
The best-performing businesses are retaining ~70% of their revenues after a year.
Retention above 50% is in the top quartile.
Most of the sample hovered around 45%.
12 month plans have better retention than monthly or quarterly plans.
___
b. Retention by Price Points and Verticals
As is evident from the chart below, retention is quite inversely correlated with the price points. Average retention at a $5 monthly ARPU was approx. ~75% while it drops to ~60% at $10. Most ARPUs hovered between $7-$12 per month. This may be a useful input in deciding your price point.

Retention when looked at through the lens of verticals is all over the place. It also gives us a pretty important lesson - Engagement and Conversion ≠ Retention. Look at the abysmal retention rates of Dating and Online gaming v/s Productivity. Entertainment seems to a winner in either case. The larger lesson here is that the continued utility of your product and the context determine how hard you have to run to keep the revenue you have earned.

6. Final Thoughts
Use these benchmarks only as guides. They are just stats from a sample. If e.g. Sequoia or Bessemer were to do this - their findings may differ significantly.
Where you fall on the charts will depends completely on your product, its context, utility and value proposition to your end customers.
It’s OK if you are not there yet. Keep iterating.
Housekeeping
As always, I look forward to hearing from you. If you liked this post, pls feel free to share this or subscribe to this newsletter using the links below. I try to write a 1000-2000 word essay once every two/three weeks.
Key takeaway - No one wants to be educated and it seems planet earth just wants to swipe on Tinder all day.